

What is a flowchart?
Flowchart definition
A flowchart is a diagram that uses symbols and arrows to visualize a process.
A flowchart is a diagram that uses symbols and arrows to visualize a process. Flowcharts, also known as flow diagrams, are a handy way to design and document each step in a workflow and illustrate how they’re interconnected. Using a standardized set of symbols, including shapes and arrows, flowcharts make it possible to communicate complex processes using a shared visual language.
Flowcharts were first used in the computing world in the 1940s. As Indiana University professor Nathan Ensmenger explains, “The idea was that an analyst would examine a problem, design an algorithmic solution, and outline that algorithm in the form of a flowchart diagram.”
But flowcharts don’t start and end with computer programming. Today, flowcharts are a useful tool for building and documenting processes, both simple and complex. They’re used in a wide variety of disciplines and fields, from software development to education to business operations and beyond.z
When to use a flowchart
In what scenarios does it make sense to create or use a flowchart? Let’s take a look at some common use cases. This list is by no means exhaustive — there are infinite ways to make flowcharts work for you.
You might use a flowchart when you want to:
- Document a process
- Identify potential breakdowns and bottlenecks in a process
- Visualize dependencies in a process
- Automate a manual process
- Visualize the flow of data
- Plan a project
- Identify the right person to own a task or project
- Troubleshoot technical issues
- Make a decision that involves multiple variables
Demystifying flowchart symbols
At first glance, flowcharts and diagrams can look overwhelming. What do all the different shapes mean? But when we take some time to understand flowchart symbols’ meanings, they start to tell a visual story. They indicate when a process starts, the logic that makes it progress, and when it comes to an end.
Basic flowchart symbols
Let’s start with the basics. These are the five symbols you’ll most commonly find in a simple flowchart.
Terminator, Start/End
Every process has a start and an end point. Use the oval shape to identify both moments.
Action, process
The rectangle shape is used for actions or instructions, the things that must be done.
Decision
The diamond shape indicates a step in the process that asks a question or requires a decision.
Connector
Use a circle when leaping from one action to another.
Flowline
Flowlines indicate the directional flow of the process and point to the next step.
Other common flowchart symbols
You can create most simple flowcharts using just five symbols — but you’re not limited to those shapes.
Different types of flowcharts also rely on different symbols. For example, Business Process Model and Notation (BPMN) diagrams use icons, while Unified Modeling Language (UML) diagrams use a much more complex notation system.
Some visual collaborators prefer to use less abstracted images to represent specific aspects of a workflow. For example, an app developer might use an image of a bug to represent all the QA steps in launching a new feature. Play around with your flowchart’s shapes and symbols to find what works best for you.

Whatever visual language you use, make sure to be consistent so that the idea or process you are mapping is easily understood.
How to make a flowchart
For almost as long as we’ve had computers, we’ve had flowchart creation software. For serious diagrammers, like the folks mapping out computer algorithms, there are dedicated tools specifically for creating complex flowcharts. However, most people don’t need something quite so robust. In fact, you probably already use a tool that offers flowcharting capabilities — for example, Microsoft Excel, Google Docs, or Google Slides.
Unfortunately, these types of flowchart software have some limitations. Most flowchart makers are designed to be extremely linear, making it difficult to adjust and iterate on the fly. They also limit your team’s ability to collaborate on diagramming in real time. Instead, you’re left playing diagramming ping-pong with your teammates. This back-and-forth can cost you valuable time and prevent you from coming to solutions quickly as a cohesive team.
If you need a flowchart maker that allows you to collaborate — especially with a remote or distributed team — you need a visual collaboration platform.
Visual collaboration platforms are especially useful when you’re in the early stages of designing a flowchart. You’ll have more flexibility with a dynamic flowchart creator that makes it easy to drag and drop symbols and quickly connect the dots — and to do it collaboratively.
Flowchart examples and templates to get you started
Possibilities for mapping and diagramming with flowcharts are endless. They can be used for something as simple as documenting a linear process, or as complex as describing a computer algorithm. So, how do you know which type of flowchart to create?
It all depends on your goal. Do you need to document a process for new employees? Understand everyone’s roles in a cross-functional project? Visualize the flow of data? There are specific types of flowcharts designed to do each of those jobs — and we’ve rounded up five of the most common for you here.
Rather than starting from scratch, use a template to jumpstart your diagramming process. For each type of flowchart, we built an easy-to-use template based on insights from consultants, product teams, project managers — the people who do this every day.
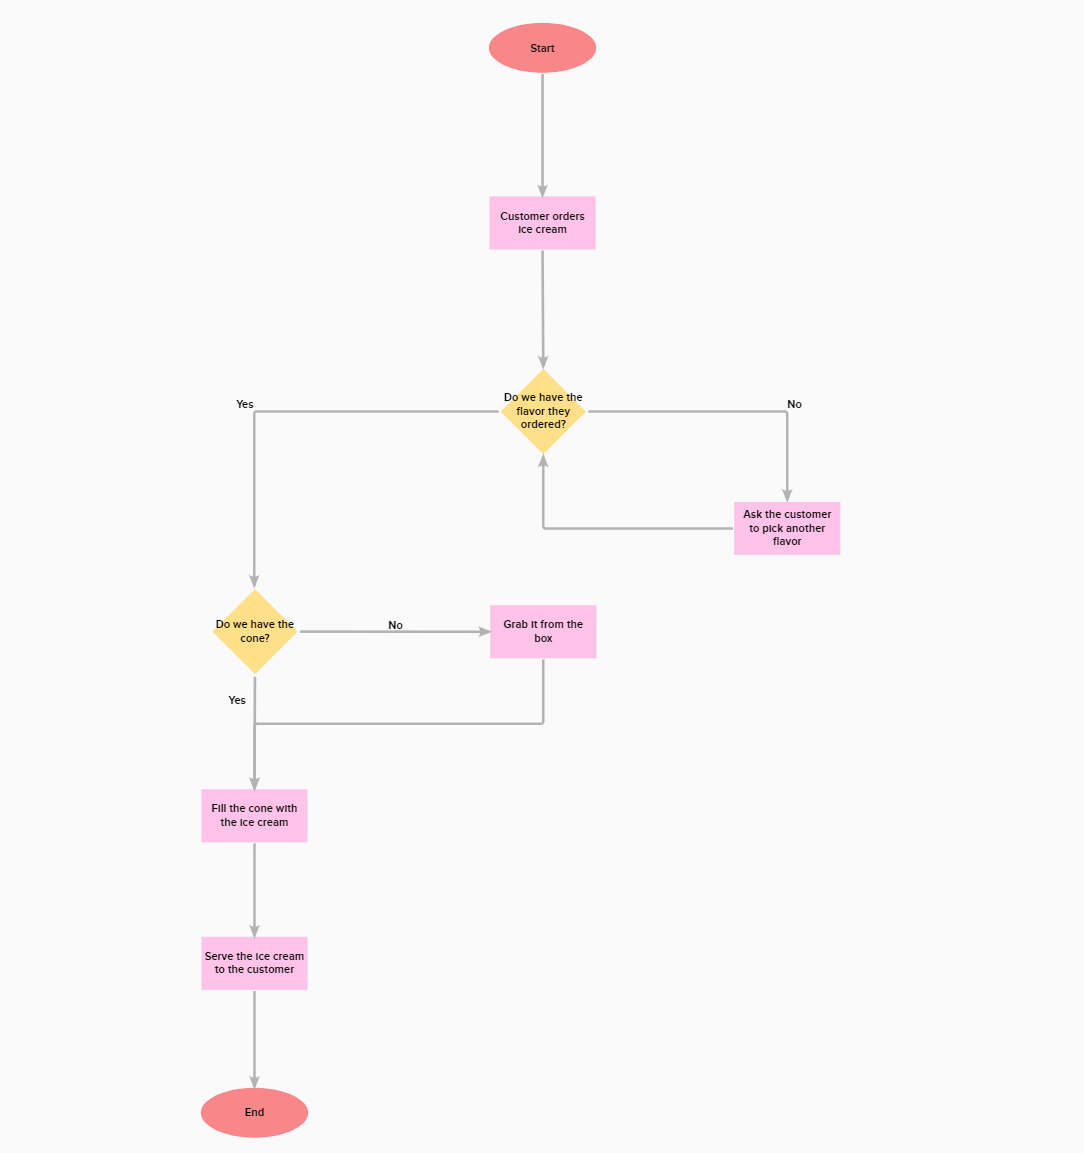
Workflow diagrams
Use a workflow diagram (also called a workflow flowchart) to visualize all the actions and steps needed to complete a project or process.
EXAMPLE
Process flowchart template
Use a process flowchart (also called a business process flow or process flow diagram) to visualize all the steps and inputs of a business process to identify opportunities for improvement.
EXAMPLE

Data flow diagram template
Use a data flow diagram (DFD) to visualize and annotate how data flows within an information system or process.
EXAMPLE

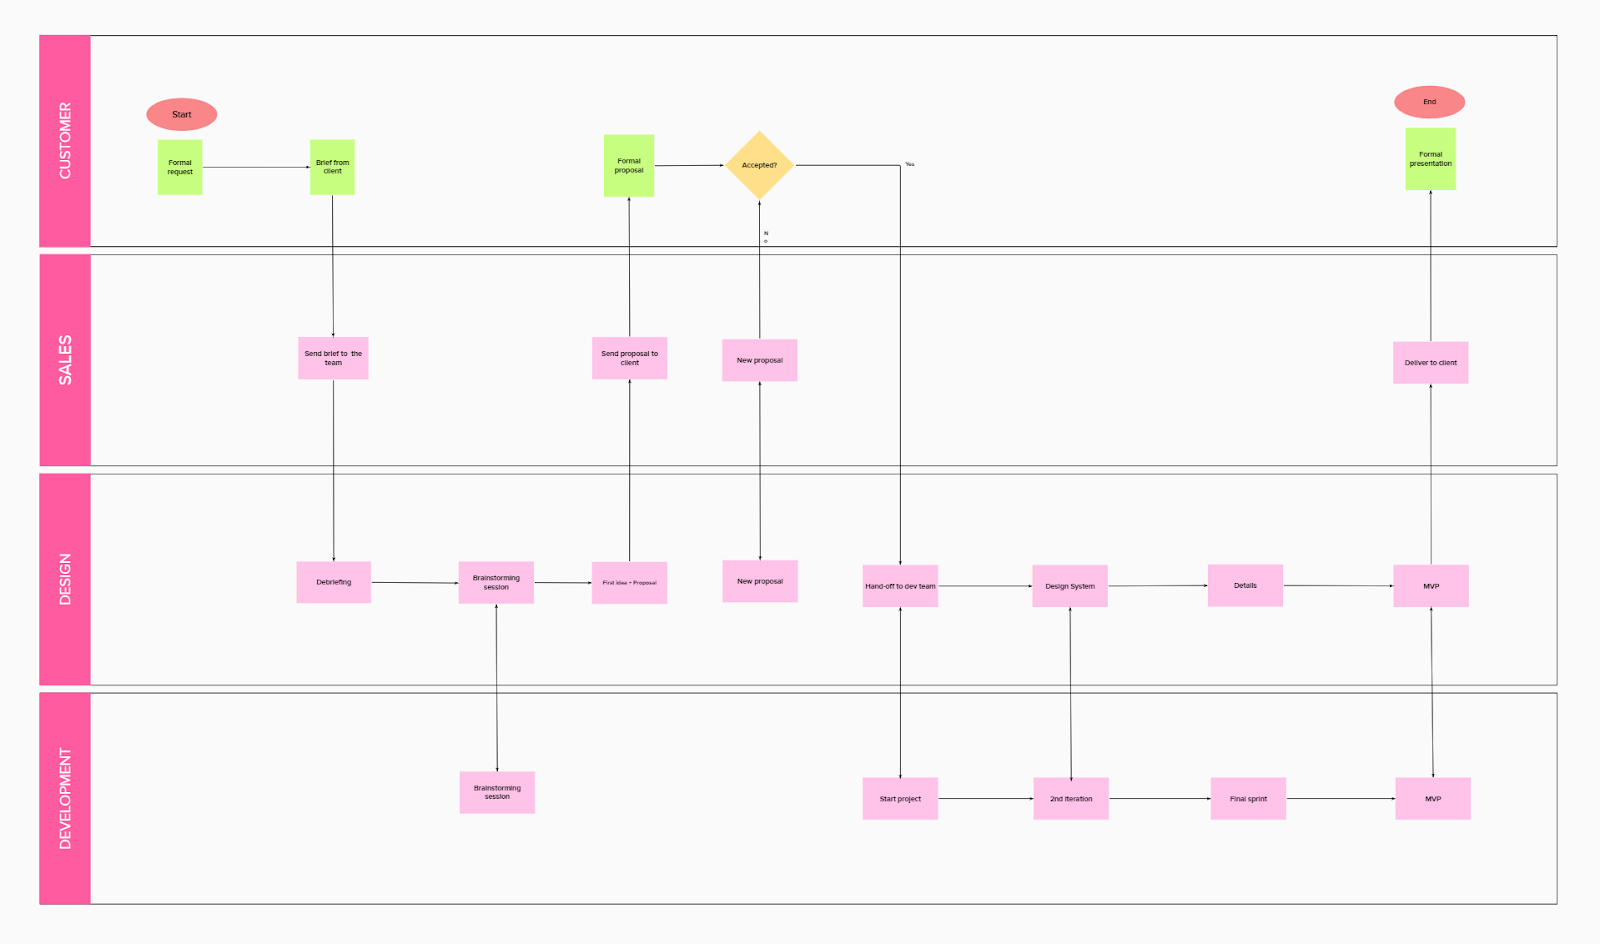
Swimlane flowchart template
Use a swimlane flowchart, or swimlane diagram, to visualize roles and responsibilities for important projects so that no one feels underwater.
EXAMPLE
Business process modeling diagram (BPMN) template
Diagram step-by-step actions and inputs in a business process.
EXAMPLE

Collaborative diagramming made easy with Mural
Anyone can visualize diagrams, flows, processes, and more in Mural to generate great ideas, structure complex processes, and optimize user experiences. Work at the speed of thought alongside teammates, clients, or customers.
About the authors
About the authors

Tagged Topics


%20(1).jpg)
%20(3).jpg)
%20(1).jpg)